
See attached document for submission.
Email address redacted.
3. Your City: Cork City in Profile
Closed26 Jun, 2020, 00:00 - 21 Aug, 2020, 16:00
3.1 Introduction
This Issues Paper is accompanied by a Cork City Socio-Economic Profile. The profile is based on census data and provides a series of detailed maps and graphics illustrating different social and economic indicators for the city. Some of the most interesting findings from the profile and their implications for the future planning of the city are set out below. The full Cork City Socio-Economic Profile is available on our website.

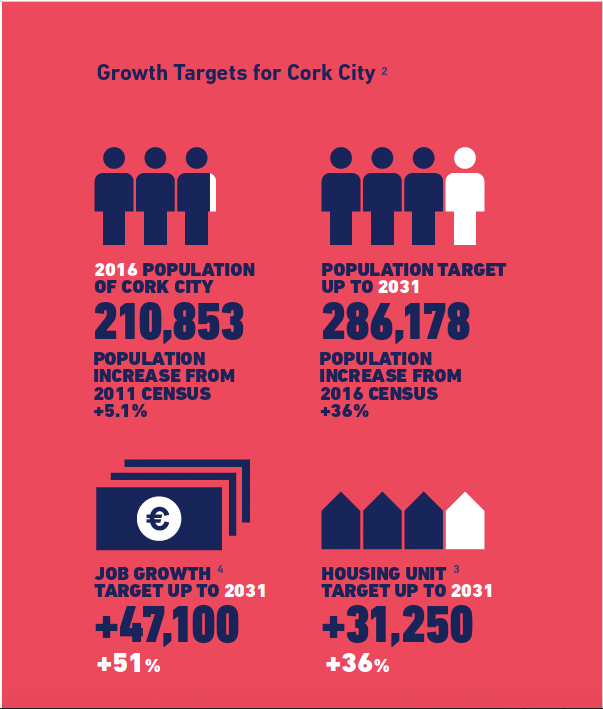
3.2. City Growth Targets
As mentioned in section 2, the National Planning Framework (NPF), the Regional Spatial and Economic Strategy (RSES) and the Cork Metropolitan Area Strategic Plan (MASP) are aligned in setting out unprecedented and ambitious population, housing and job growth targets for Cork City.
The growth targets set out for Cork City up to 2031 are seeking to increase the existing population and housing base by over one third and the existing jobs base by over 50%5. The housing unit targets would require an average annual delivery of over 2,000 new units to be sustained during this 15-year period to 2031 as required to meet the NPF population target for growth over the 2016 census population.
While these targets are ambitious and will require investment in critical infrastructure over the short, medium and long terms, they are in place to help the city and the Southern Region create more compact urban growth, more balanced regional growth and act as a counterbalance to Dublin.
3.3. City Growth Trends
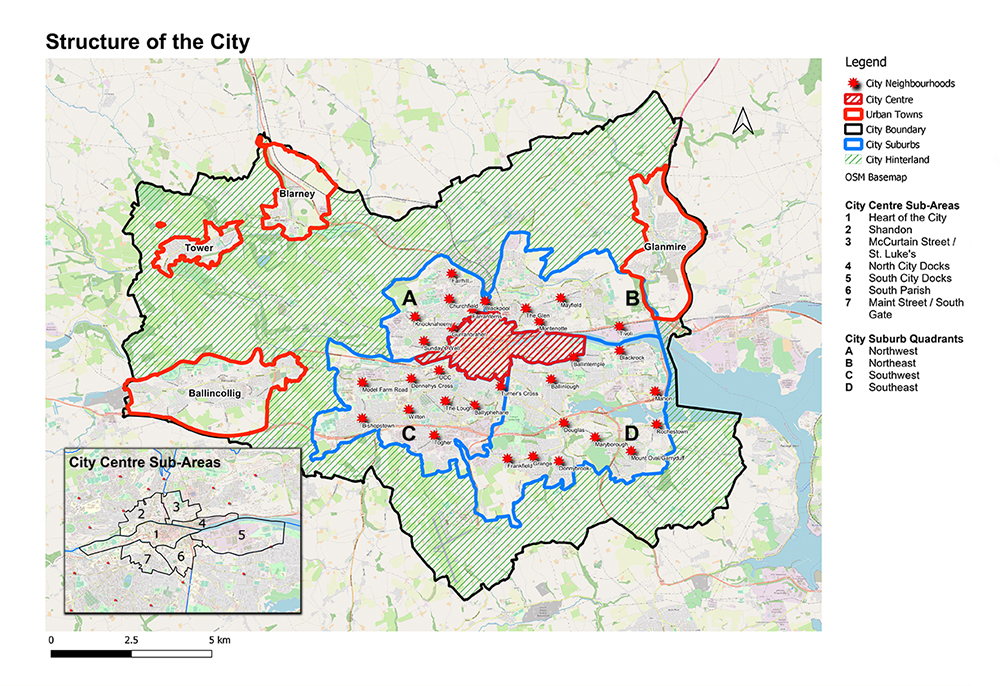
The Cork City Socio-Economic Profile provides a comprehensive analysis of census data for the city, covering a variety of indicators. The profile analyses the characteristics of the city by dividing it into the following five areas.
- The City Centre and it’s collection of sub- areas;
- The City Suburbs with it’s collection of city neighbourhoods;
- The five designated RAPID Areas located within the City Suburbs;
- The four Urban Towns within the city; and 5. The City Hinterland, being the remainder of the city, including smaller settlements and other land uses adjacent to the city.
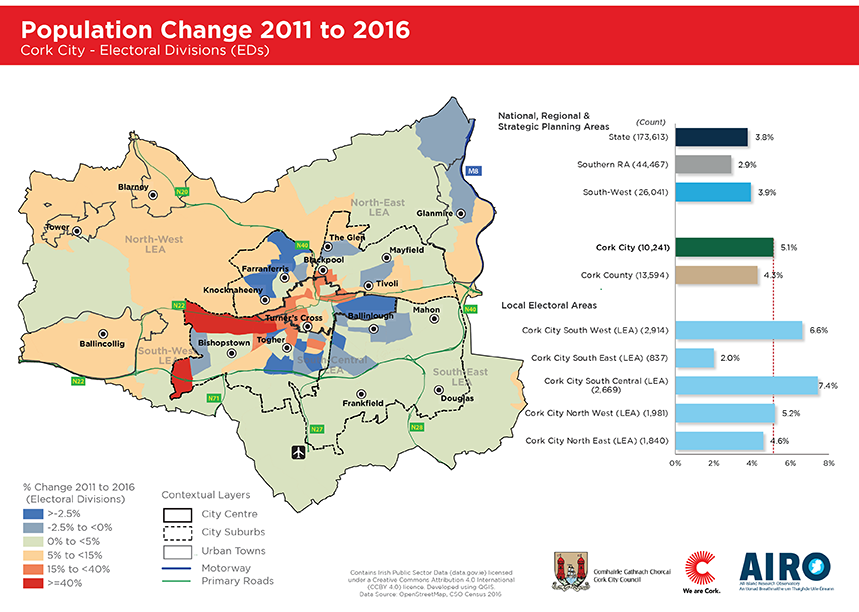
(i) Population Change
Between 2011 and 2016, different neighbourhoods within the city experienced very different rates of population change. Significant growth occurred within the City Centre and some surrounding neighbourhoods, such as Blackpool, Turners Cross and Bishopstown. With limited new residential development, this is largely the result of an intensification of use of existing buildings for apartments/flats and increases in student numbers living in the City Centre.
In contrast, the City Suburbs experienced minimum or negative population change. There were small levels of population growth in Mahon, Douglas and Frankfield, while the Glen, Ballinlough and Farranferris experienced a population decline. These patterns are a result of existing family households maturing and limited new house construction in those areas.
The city’s Urban Towns largely experienced population growth, with Ballincollig, Tower and Blarney seeing increases in population. This growth results from greater numbers of new house construction and increasing numbers of young growing families. In contrast, Glanmire experienced a slight population decline. The City Hinterland generally experienced increased growth with the northwest area seeing higher than average levels of population change. This was largely the result of small scale and one-off residential developments.
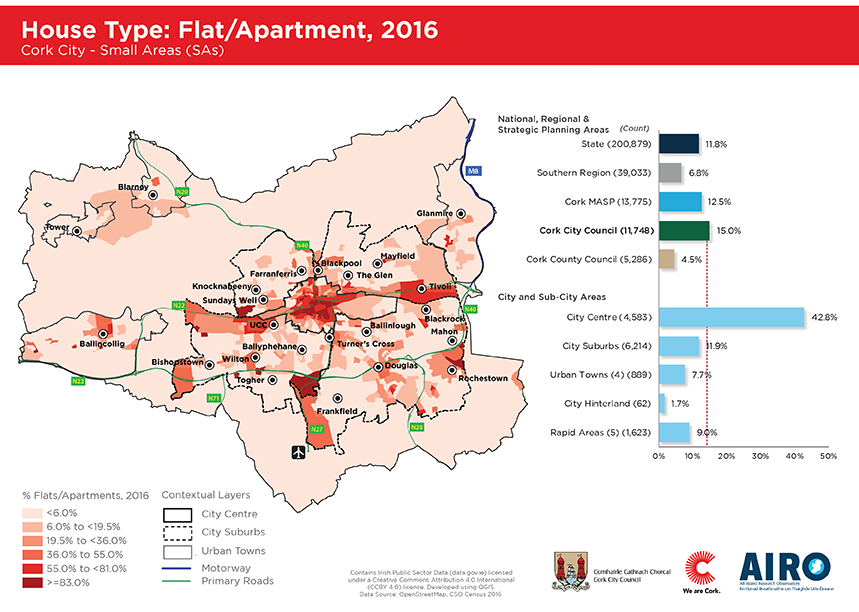
(ii) Housing Type
The predominant house type in Cork City remains the detached, semi-detached or terraced house, accounting for over 85% of the city’s housing stock in 2016. Apartments or flats accounted for 15% of Cork City’s total housing stock in 2016.
Apartments are predominantly found within the City Centre, accounting for over 50% of the total housing stock in the majority of City Centre neighbourhoods. Pockets within the City Suburbs and the four Urban Towns also had higher than average rates, including Mahon, Douglas and Ballincollig. The majority of the City Suburbs and the City Hinterland have few or no apartments or flats, being typically less than 6% of the housing stock in these areas.
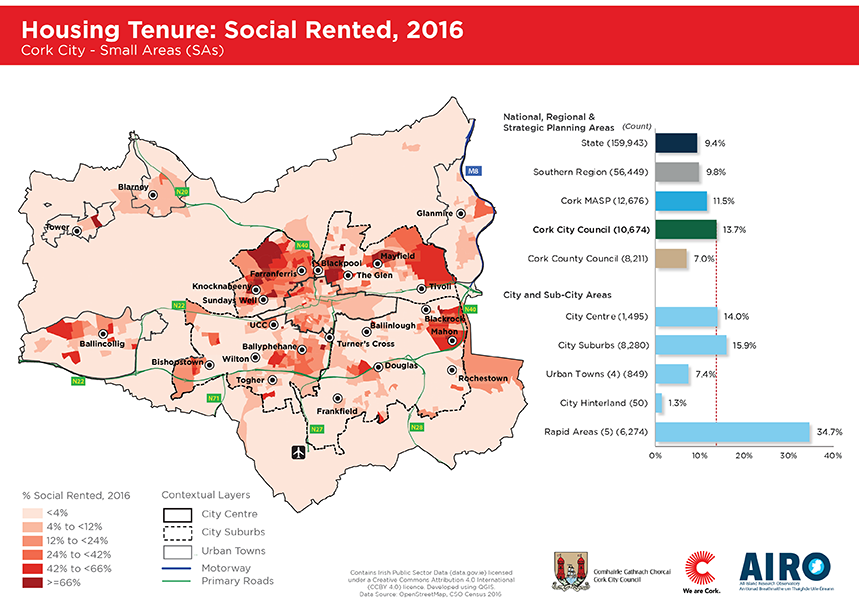
(iii) Housing Tenure
Housing tenure in Ireland can be broken down into three main categories; owner occupied, private rental and social housing. The total housing stock in Cork City in 2016 is predominantly made up of owner occupied housing (58%), with the combination of private rental (24%) and social housing (14%) accounting for less of the overall share.
Owner occupied housing is the dominant tenure found in the four Urban Towns (72%) and in the City Hinterland (84%). While in contrast, less than one in four residential units in the City Centre are owner occupied (25%).
Private rental housing accounts for 24% of the city’s overall housing stock. There’s a notably higher number of private rentals in the City Centre (52%), with a much lower percentage in the City Suburbs (20%), the four Urban Towns (17%) and the Rapid Areas (10%).
Just under 14% of Cork City’s total housing stock is social housing. Blackpool, Mahon, Mayfield and parts of Ballincollig and Tower have higher levels, being above 40% of their totals. Blarney, Frankfield and Douglas have lower levels, generally below 4% of their totals.
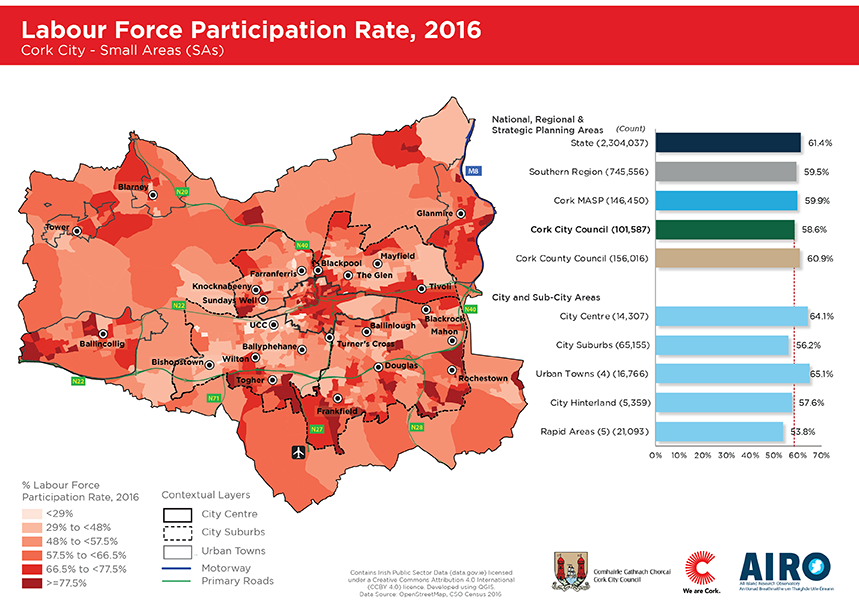
(iv) Labour Force Participation Rate
The Labour Force Participation Rate (LFPR) is calculated as the labour force divided by the total working population. In 2016, Cork City’s LFPR was 59%, being slightly below the national average. The City Centre and adjoining neighbourhoods generally have a higher LFPR, while the city suburbs generally have been lower than average. These patterns are influenced by the location of both the student and older age populations within the city. The Urban Towns of Ballincollig, Tower, Blarney and Glanmire have a higher than average LFPR, reflecting higher concentrations of young working families
 .
.
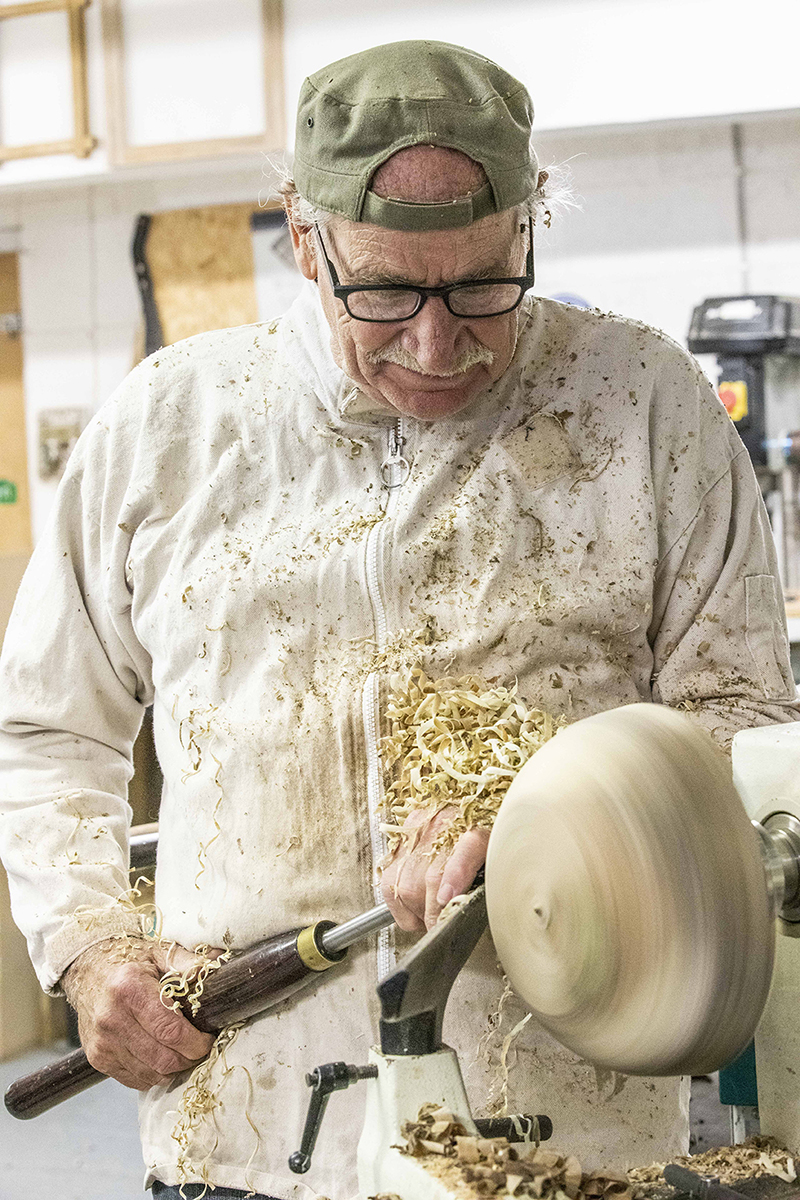
(v) Transport Modes
The mode of transportation used by those living in Cork City to travel to work/education in 2016 varied greatly. Over 22% of the
city’s population used green modes, with only 9% using public transport and 63% using private modes.
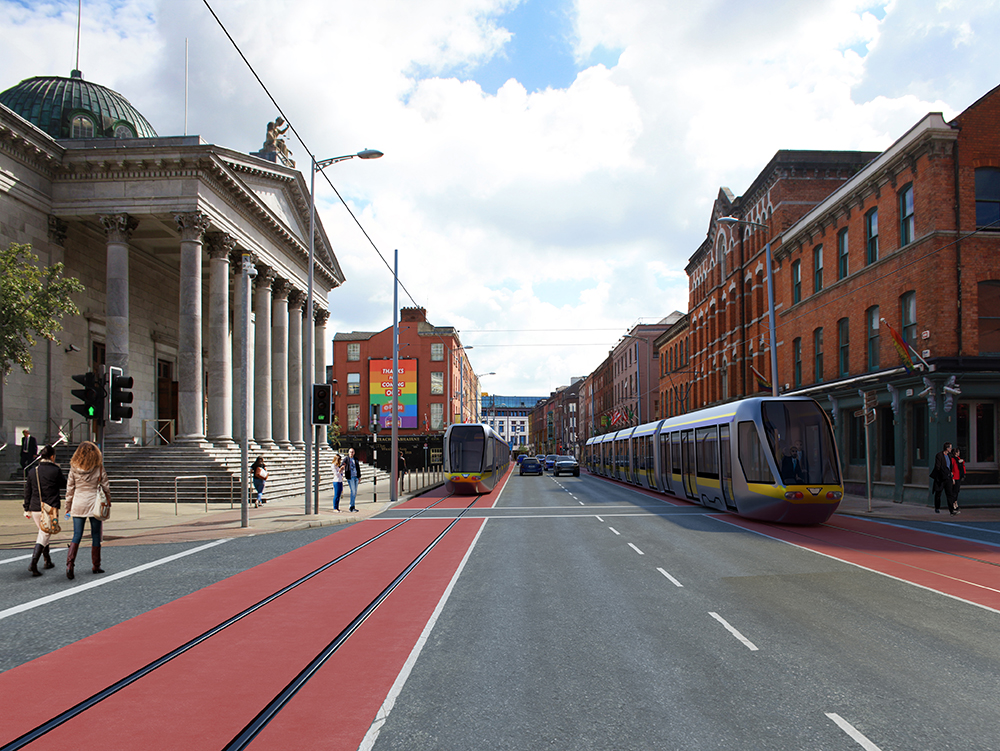
More than one in five Cork City residents walk or cycle to work or education. With 47% of residents of the City Centre using green modes there is a relatively high use of walking and cycling by residents of the City Centre. However, there are lower levels of cycling and walking to work or education by people living further out. The use of public transport by Cork City residents to travel to work/education is lower than the national average. Less than one in ten Cork City residents travel to work/education by public transport, with significantly higher levels occurring within the City Centre. That stated, there is evidence of a significant increase in the use of public transport in Cork City since the publication of the 2016 Census.
The dominant choice for Cork City residents is to travel to work/ education by private car, van, lorry, etc. The use of private modes accounts for nearly two thirds of the total for these journeys in the city and matches the national average. The pattern within the city is a reverse of that for green modes, with significantly higher usage of private modes (over 80%) taken by those living outside the City Centre and the City Suburbs.
![]()
![]()
![]()
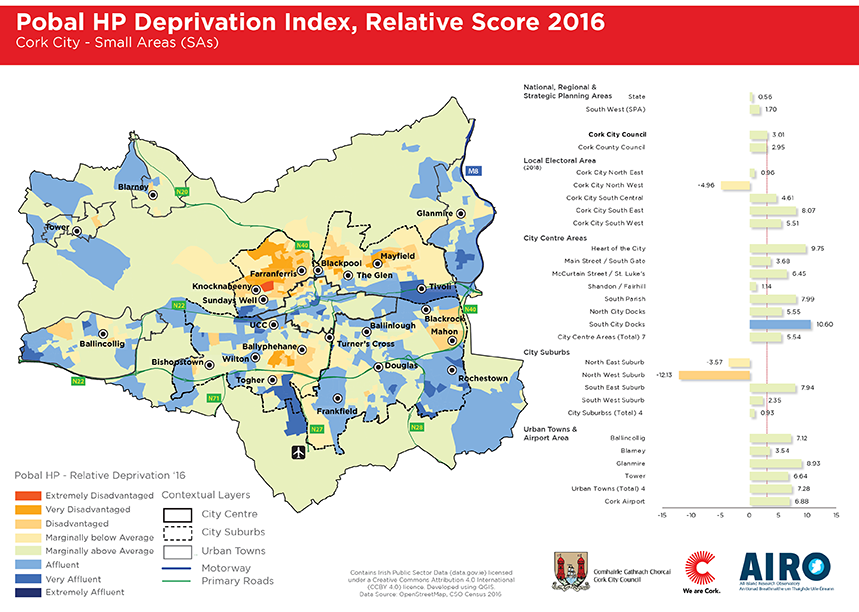
(vi) Social Profile
The Pobal HP Deprivation Index provides a method of measuring the relative affluence or disadvantage of particular geographical areas using data compiled from various census categories, such as unemployment, educational attainment and population change. Cork City’s deprivation rate is classified as marginally above average, with its index rating (3.01) notably higher than the national average (0.56) but comparable to the wider Cork county area (2.95). Within the city there is a significant range, with the five Rapid Areas being classified as disadvantaged. Pockets of the City Suburbs, Ballincollig, Glanmire, Tower and Blarney are classified as being marginally below average. Areas within the City Centre, the City Suburbs and peripheral areas of the city are designated as affluent.
3.4 Key Questions
- Should future population growth be allocated in line with recent population trends within the city, or should specific parts of the city be considered for concentrated growth? If so, where?
- What types of housing (e.g. houses, apartments) and tenures (e.g. owner occupied, private rental, social) should be provided to meetpopulation growth targets for Cork City? Where and how should they be planned for?
- How can the next City Development Plan help to increase participation in the labour force throughout the city?
- How best can we increase the percentage of people using active travel (walking and cycling) and public transport in the city?
- How can the next City Development Plan help increase access to jobs throughout the city, but especially in disadvantaged areas?
Contents
Materials
References
Observations
Observations
The importance of maintaining appropriate levels of disabled parking spaces, in an increasingly pedestrianised City Centre.
03 Your City: Your City in Profile: Compact Growth and Actions
03 Your City: Your City in Profile
Growth should happen from the centre out, whether this is the centre of the city or the centre of a neighbourhood. We should focus on “15 minute city” -...
Cork city profile and social inclusion
Cork City Council is unique nationally in having retained the RAPID programme when it was discontinued at the outset of the economic downturn. Dedicated staff collaborate with communities across the...
Social and Community Facilities
Over 20 strategic housing developments have been initiatied in Cork city. I am concerned that the social and community facilities associated with these developments are inadequate. The local...
Future Population Growth
Should future population growth be allocated in line with recent population trends within the city, or should specific parts of the city be considered for concentrated growth? If so, where?...